My Favorite Stock Watch List
I always tell my members that there are no major differences between a new trader and a successful trader other than the following:
- Good preparedness and reflection.
- Experience.
- High awareness.
Awareness is its own edge. A trading strategy can be as an edge, but a trader can have more than one. If you have higher awareness than the average trader, you are giving yourself an advantage. There are various ways to increase your overall level of awareness. Being present, being prepared, and keep various watch lists with stocks pertaining to your niche. Personally, my niche revolves around my favorite patterns and setups. That being said, your watch lists should be 100% catered to YOUR strategy!
$90 to $120
My favorite watch list is the $90-$120 watch list. This watch list is based around the rule that a stock that is surpassing $90 for the first time ever is likely to hit $120 within a few months. This has worked for me numerous times in the past and is widely known in the investing community. Currently, my watch list has about fifteen stocks. We'll just be using two stocks as examples and how they should be played. Keep in mind that the companies that are selected to be on this watch list should have strong growth outlook. The most common investing strategies are based on finding undervalued stocks, but this is not one of them. With that being said, let's jump into the two examples!
Chart Example #1
The two chart examples that I'll be referring to are NVIDIA Corporation (NVDA) and Puma Biotechnology (PBYI) . As previously mentioned, there has to be strong growth outlook for these stocks to even make it to the watch list. As outlook can fluctuate, there is only one exception to this rule - the stock has to have some sort of NEW hype surrounding it. This is very common for biotechnology stocks, A.I. stocks, or any new type of products/technology that can potentially penetrate and dominate an industry. For example, PBYI has plenty of hype surrounding it due to clinical trials and sales for its new products. Its pipeline is quite extensive and drives speculation:
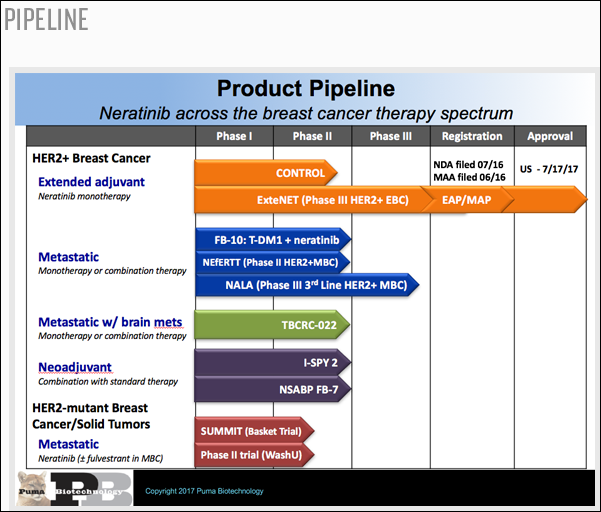
If you are overwhelmed by the products, don't worry. You don't actually need to know about every aspect of the company! Just that it has short and long-term catalysts that drive speculation. This requires little analysis and just an understanding of how businesses operate. What we really care about is the chart!
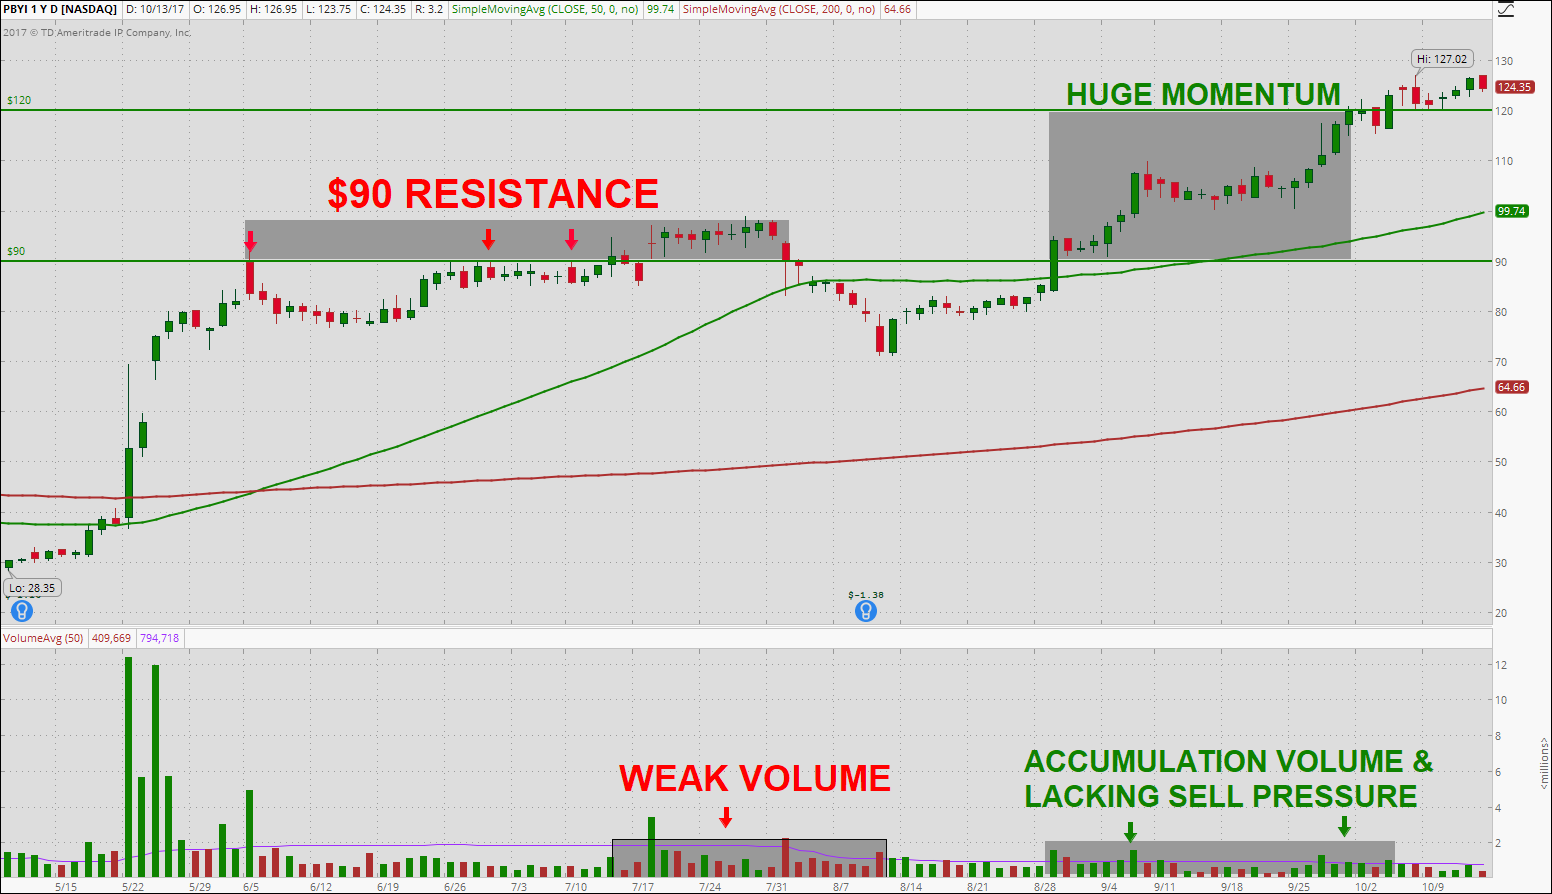 PBYI is an example of what a realistic $90-$120 mover. Most traders would try to show you a chart that goes from $90-$120 without revisiting any lower levels, but that's not how 99% of stocks move. Stocks rarely move in a straight line, so you need to use price action and volume analysis to determine whether or not the stock will move to $120. Let's make some basic notes about this chart:
- $90 clearly acted as resistance numerous times. When the stock finally broke and held $90 for multiple days, the price barely moved and there was a lot of sell volume. You can tell that there was sell pressure due to the large, red volume bars.
- The first sign of accumulation volume (large, consistently green bars) and the sharp increases in price showed increasing momentum for the big $90-$120 push.
- The chart lacks technical indicators.
Money Flow
To keep things simple, I'll add one technical indicator that has worked well historically for $90-$120 movers. For a stock to move $30 and hold its gains, long-term investors need to be accumulating shares. This is best represented by the Chalkin Money Flow indicator. This is a basic indicator that signals money flowing into the stock when it crosses over the zero line and vice versa.
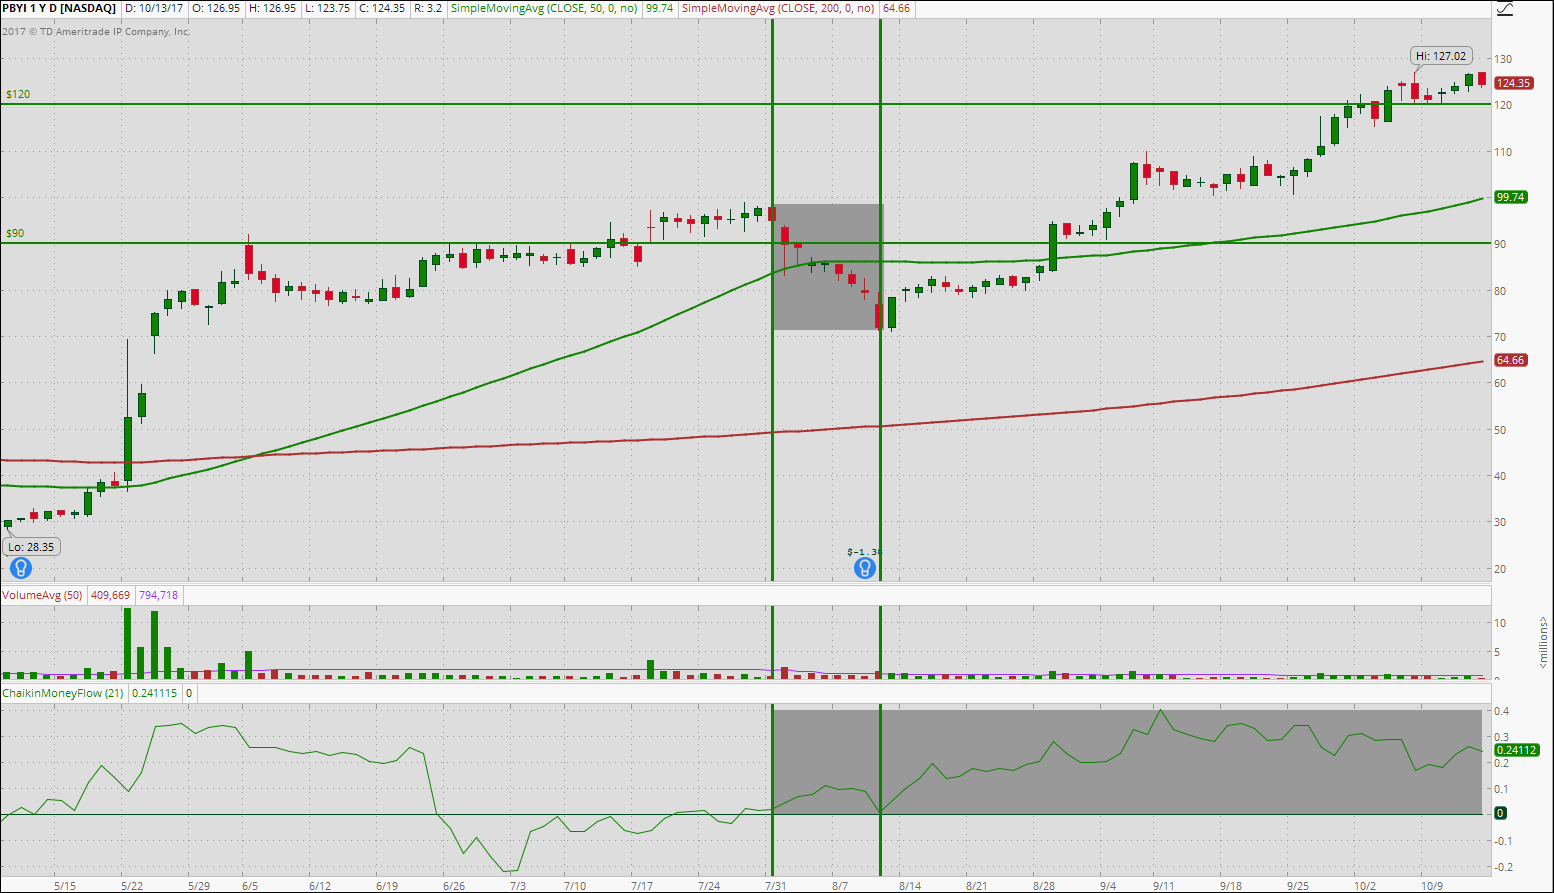
As you can see, even though the price was decreasing during that two-week period, money was still flowing into the stock. The Chalkin Money Flow indicator shows a move over the zero line with consistent inflow. This indicator won't work for every single chart, but it reassures us that the stock is likely to make a move to $120. This money flow combined with the price momentum and accumulation volume indicates a push higher. One final note about this chart is that if you want to set a price alert so that you don't have to watch this stock all day, you'll have to set two. Set one alert for $90 and the other at least 1-5% above to make sure that you don't miss the move if it struggles holding that level. Overall, PBYI is a great example of a stock that made the $90-$120 move that we banked on in the Trade with Techs chat room. Simple technical analysis and watch list maintenance can result in much higher profits.
Chart Example #2
NVDA is an even more ideal example of a $90-$120 stock. It had plenty of hype and aggressive top and bottom line growth.
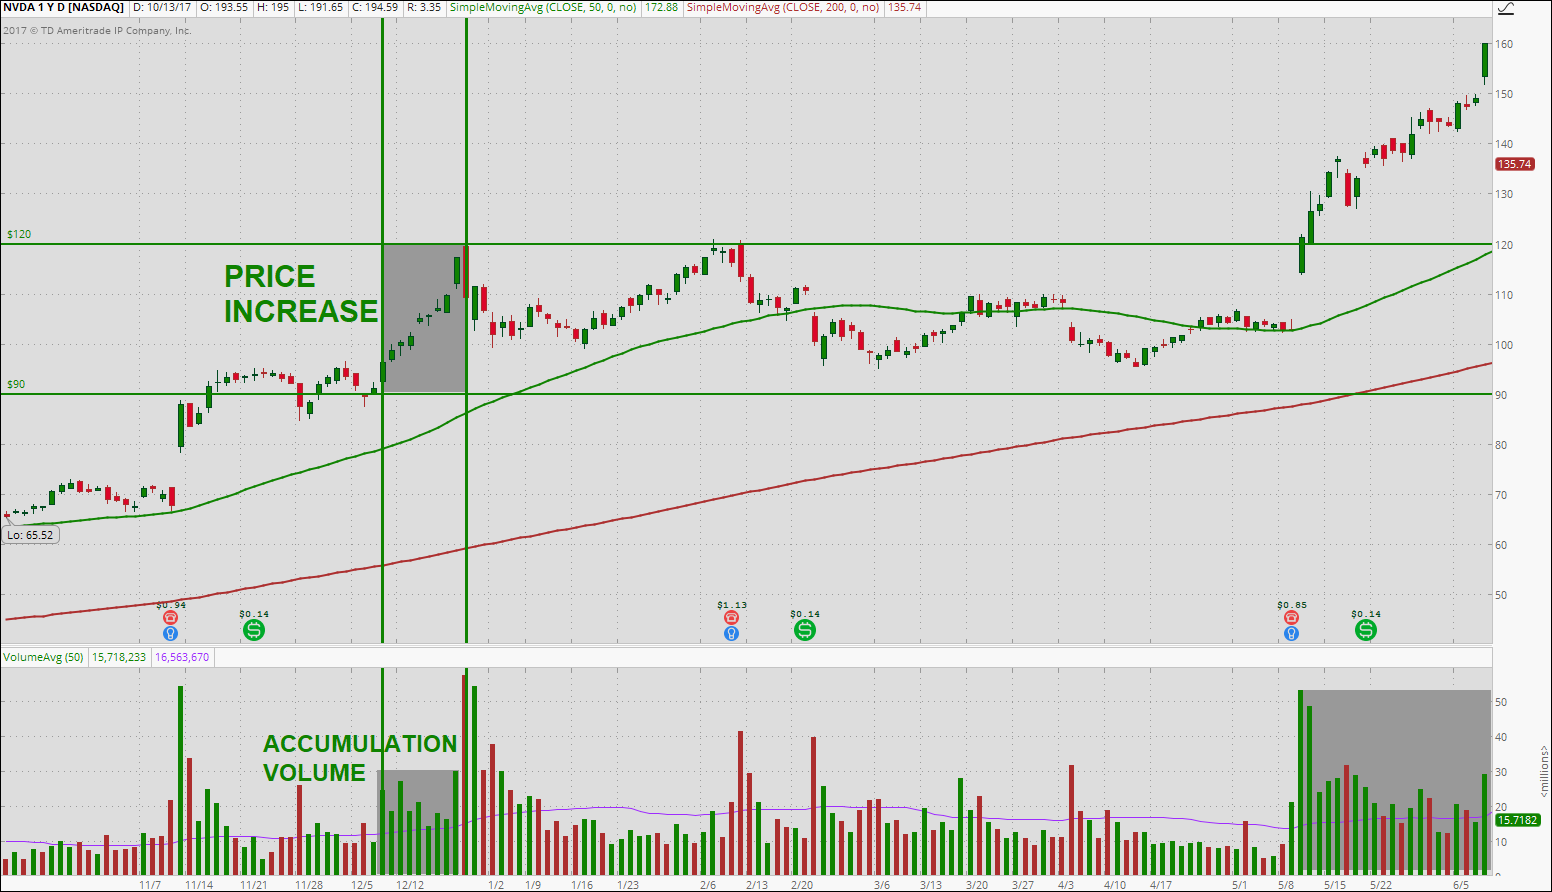 NVDA showed a similar pattern of accumulation volume and a rapid increase in price. The first move over $90 did not show signs of increasing momentum or accumulation. Notice that $120 acted as resistance multiple times. The first rejection was obvious price taking from investors who use the same rule. The second time around was likely because $120 had been proven to be historical resistance. Third time seemed to be the charm on strong earnings and huge, consistent accumulation volume. NVDA ended up running up to just under $200 but made for a quick $90-$120 mover in just under two weeks.
CONCLUSION
The $90-$120 watch list is easy to manage and although that might not seem like too big a price swing, options traders could easily get 1,000%+ returns in a short-time period. Remember the rules when watching and trading these movers:
- The stock needs to be surpassing $90 for the first time to be on the watch list. It cannot pullback from $120+ to $90 for this to work.
- The stock needs to have some kind of catalyst fueling the move.
- The stock chart needs to show signs of healthy volume and price action to make the $90-$120 move.
By putting in the few minutes per week to update this watch list and set price alerts, you can increase your profits and take advantage of some opportunities you may have missed otherwise.