How to Avoid Getting Scared Out of a Stock
The obvious way to avoid getting scared out of a trade is to create a game plan. Since this requires way too much time to dive into, we will focus on a few simpler rules that you can create for yourself! There are three realizations that were absolutely glass shattering for me:
- Defining risk removes emotion.
- No stock goes straight up (or down).
- Support and resistance can act as levels OR zones.
Seeing as these are all very different points, let's start with #1.
Defining Risk
This is one of the hardest aspects of trading because it's something that needs to be done without hand holding. As a technical trader with personal investment objectives, my stop order should be placed based on MY COMFORT, not someone else's. That being said, defining risk is tough if you don't know how to chart support or what type of risk works best for your niche. Let's use a bull flag as an example since it's a pretty common pattern breakout for technical traders.
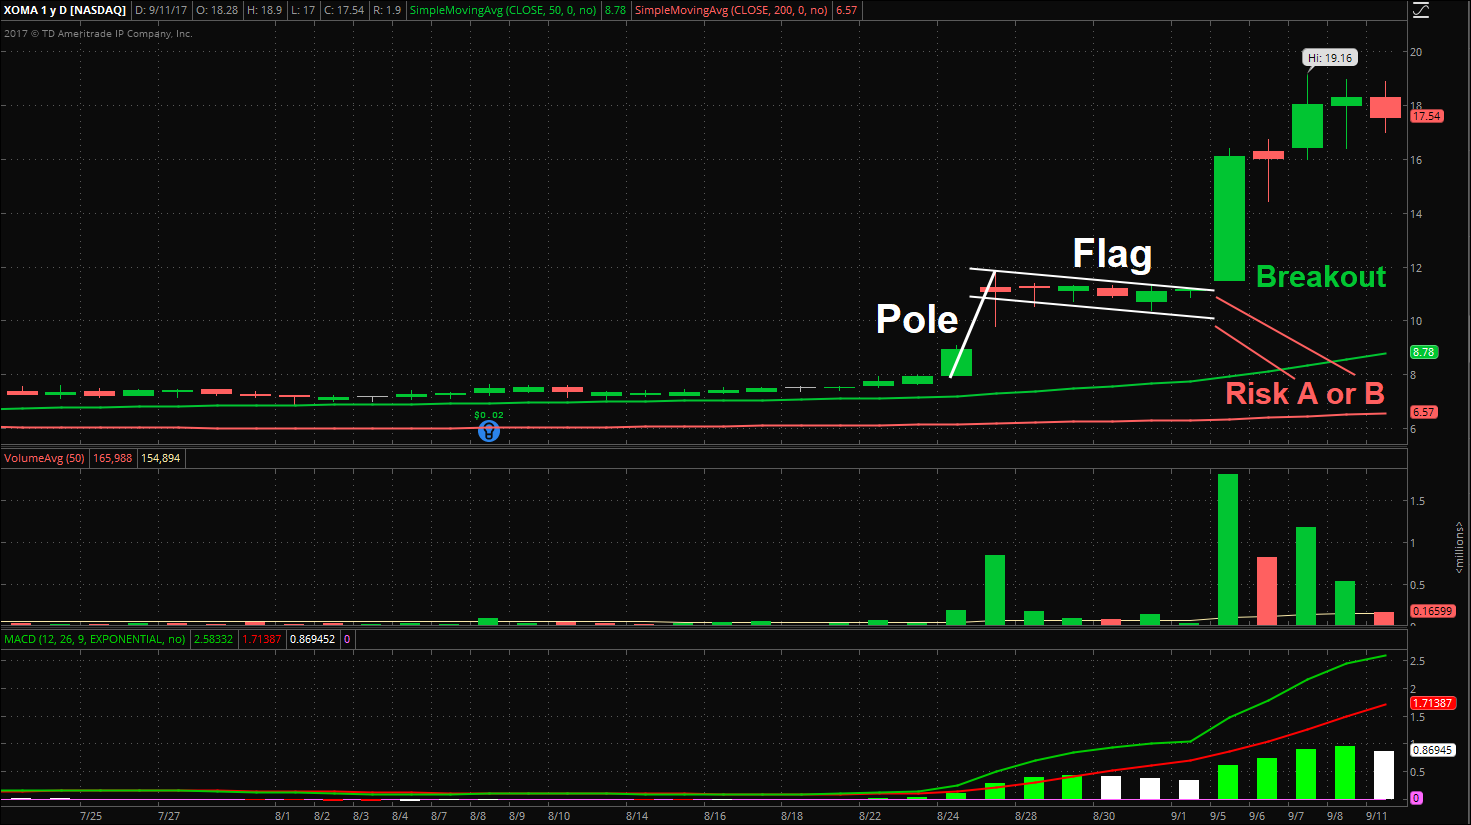 The chart above is the 1 year 1 day chart time frame for XOMA.
XOMA broke out of a bull flag on the morning of 9/5/17 on good news. Before we go into the risk points A and B, let's break down how a bull flag works. Essentially, we have a sudden move to the upside (Pole), consolidation in a trend channel (Flag), and then a breakout. It is a continuation pattern and one of my favorite long setups. Now when a stock breaks out of a bulls flag, you establish the target based on the pole. Since the length of the pole in this case is ~$4.80 then we add that to the breakout point to get our price target. It broke out at $11.20 so that gives us a price target of $16 ($4.80+$11.20). Although defining reward is important, we're discussing risk. The risk in this scenario would typically be down to A, as that would give you a good cushion and is on a trend channel breakdown. However, if you waited for confirmation (break and hold of flag), then you have a tighter risk down to B. Both of these situations are favorable, but what's important is that risk is defined. If risk is defined, there are no "buts" or "what ifs", there's just a yes or a no. Let's move onto #2.
No Stock Goes Straight Up (or Down)
This point here is for all the newbies who have not realized this. Defining risk is more advanced, but the need to do that is a result of a stock's inability to go straight up. Now, let me clarify one thing first:
STOCKS CAN GO STRAIGHT UP! BUT IF YOU RELY ON THIS TYPE OF A SETUP, YOU MIGHT AS WELL START POURING LIGHTER FLUID ON YOUR LIFE SAVINGS!
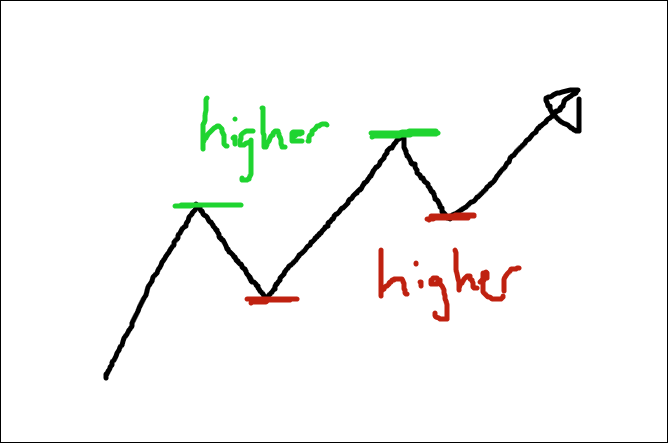
If you rely on movers that go straight up, you will inevitably get caught in a huge selloff. The moves are not sustainable and are unhealthy. Trading the trend is much better. Now to understand that no stock goes straight up, you need to understand HOW to spot a trend that is forming. For a trend to form, you need higher swing lows and higher swing highs. This is basic price action analysis. I've included a visual below:
 If you are buying a trending stock into strength and it is not breaking out of a pattern setup, then you are likely overpaying for shares. This was groundbreaking for me when I was a newbie as I would just wait a minute after I got the urge to buy, and then buy the dip shortly after. It allows for better execution AND you won't get scared out of a stock if you realize that the stock is making a healthy move with higher swing lows, rather than just going straight up. Below is an intraday example of a recent successful trade on TEVA:
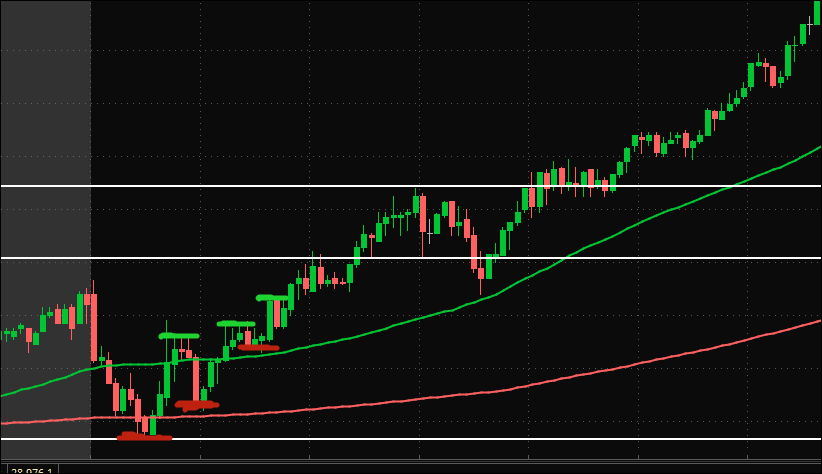 Our game plan in the Trade with Techs chat room ($50/month) was for a bounce off of support (white line) and then a trend reversal. For a trend reversal, you need higher swing lows and higher swing highs. While the first drop since the bounce (second red line) may have been concerning, it was fine as long as we ended up with higher swing lows/highs. That not only scares investors out of stock but also traps emotional short-biased traders who entered on the pullback. This move played out in our favor since we understood the price action. I traded TEVA from $17.47-$18.74.
Support and Resistance
This is a complex topic for a lot of reasons, but understand that support or resistance isn't necessarily just one level, it could be a zone. It's all based off of supply and demand, which I will touch on in a later webinar. This is mainly useful for setting stop losses as you can easily mess up a trade if you set your stop "under support" but still in the overall support zone. I will touch on this topic more in-depth in a later blog post as well, but I encourage you to set your stops slightly looser if you find that you are getting stopped out right before the stop reverses back. If that's the case, you may save yourself a lot of money down the road and maximize opportunities.
In conclusion, creating a full game plan puts you at a huge advantage as a portfolio manager. If you want to stop getting scared out of stocks, understand the components of a trend, identify the support/resistance, and DEFINE YOUR RISK!
Liked this blog post? Share it with other traders!
[DISPLAY_ULTIMATE_PLUS]